Mitigation or even reducing energy demand would provide significant benefits for South Africa. The country has to deal with repeated electricity blackouts due to a growing economy with energy intensive industries in combination with an overstrained, primarily coal-based electricity generation system. With the targets to cope with these infrastructural challenges and to reduce South Africa’s impact on climate change, the South African government revised the National Energy Efficiency Strategy (NEES) to reduce the energy consumption significantly and to foster energy efficiency. South Africa ratified the Kyoto Protocol with aims to reduce the greenhouse gas emissions and to shift towards a low carbon economy. The country committed itself to limit the emissions to 34% below the business-as-usual growth trajectory by 2020, and by 42% by 2025.
Especially the buildings sector is a priority in South Africa as it is a major user of energy with significant potentials to reduce energy consumption and greenhouse gas emissions. In new buildings, in the commercial sector 40 to 50% and in the residential sector 30 to 40% of energy could be saved. The aim of the regulators is to support buildings that are better insulated, less prone to air leaks and consequently less reliant on electricity for heating and cooling purposes. Appliances are another relevant cause for a large amount of energy consumption. Therefore - with buildings and appliances - the government put a focus on these two important areas with the general goal to achieve a low carbon economy. Programmes with major relevance to achieve this goal are mandatory energy performance standards for buildings and appliances, appliance labelling schemes, demonstration programmes, energy management system promotions as well as awareness raising campaigns. These measures illustrate that South Africa recognized the relevance of low energy buildings and energy efficient appliances. The efforts to increase energy efficiency have already improved but more still needs to be done, in particular as adequate policies and measures have already been successfully demonstrated in other world regions and could be adapted to South Africa’s situation.
 Buildings Tab Buildings Tab |
 Policy Tab Policy Tab |
 Appliances Tab Appliances Tab |
|---|---|---|
| In the Buildings section, you will find an overview of the building sector, information on the bigEE Strategic Approach in South Africa, country specific recommendations, and Good Practice examples from the various regions of South Africa. | The Policy section will provide to you an overview and analysis of key policies and programmes the government of South Africa has adopted to promote energy efficiency in buildings and appliances. | The Appliances section will illustrate national best available technologies (BAT), non-BAT appliances typically used in South Africa as well as analyses of the potential costs and benefits of energy efficiency improvements. |
| Total population | 52,982,000 |
| Size | 1,221,037 km² |
| GDP (PPP) (2013) | 350.6 billion US-$ |
| GDP (PPP) per capita (2013) | 6,617.91 US-$ |
| GDP real growth rate (2013) | 3% |
South Africa has abundant resources of raw materials and has experienced over the last decades an enormous growth in economy driven to a large extent by energy intensive extraction industries. As a consequence, it is nowadays one of the world´s most energy-intensive economies, with more than 94% of electricity produced from coal (OECD/IEA 2013b). The total primary energy supply by source is divided into 70% of coal and coal products, 15% oil and oil products, 10% renewable energy, 3% natural gas and 2% nuclear power. In 2011 the overall energy supply was 141 million tonnes of oil-equivalent, and total final consumption was 71 million tonnes (or 2.7 t per capita) of oil-equivalent in 2010 (BPB 2013, IEA 2013b). For comparison, this is approximately equivalent to one fifth of the energy supply of the entire African continent (OECD/IEA 2013). The state-owned electricity supplier Eskom is the largest provider of energy and generates 95% of electricity used in South Africa (UNEP SBCI 2009). Thereby, the large dependence on coal results in massive emissions of greenhouse gases. With 460 Mio.t CO2 (9,1 t per capita) in 2010, South Africa was the 14th highest emitter of greenhouse gases worldwide (BPB 2013, IEA 2013b). In contrast, with 384,708 millions US-$, it was ranking 28th in the gross domestic product 2012 (World Bank 2013). This demonstrates the high emissions of greenhouse gases at a comparatively lower economic performance. Under projections that assume continued economic growth on a modest but stable path, South Africa would require an estimated 40,000 megawatts of new generation capacity by 2025 (tied to annual growth in GDP of around 3.65% or less according to IEA 2012).
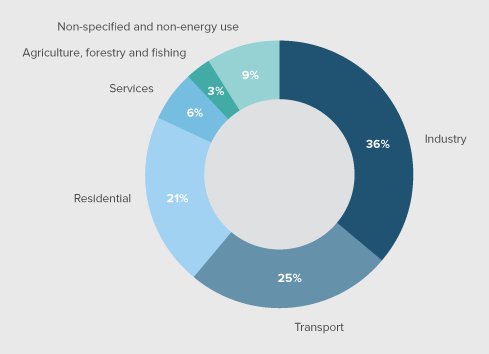
Particularly the industrial sector dominates the overall energy use in South Africa with 36% in 2011 (other sectors: transport 25%; residential 21%; services 6%, agriculture, forestry and fishing 3%; non-specified and non energy use 9%) (see next figure). But energy consumption has increased across all sectors over the past decade. The population of South Africa increased by 36% between 1990 and 2010, while energy use in the building sector grew even by nearly 50% during the same period. Due to the rapid growth in demand, South Africa experienced widespread electricity blackouts in 2008 and also in the following years. At the same time, a large number of households still has no access to electricity at all. In 2012 the electrification rate was estimated to be 73% by the Development Bank of South Africa, with 3.4 million households remaining without electricity.
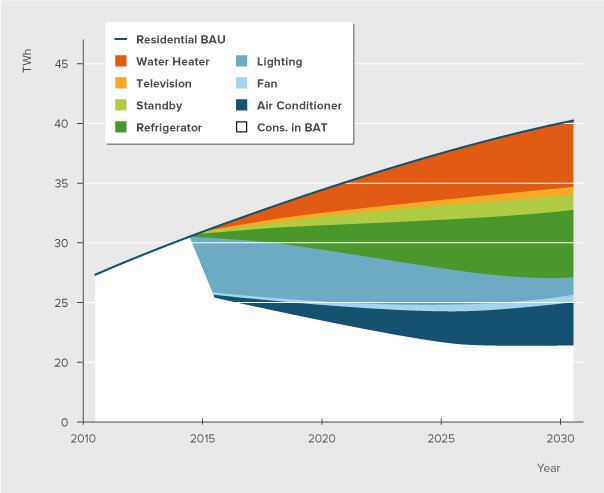
However, as the overall potentials to reduce the energy consumption and to increase energy efficiency in the buildings and appliances sectors are high, there are also good opportunities to tackle the strained situation in the South African energy system.
References
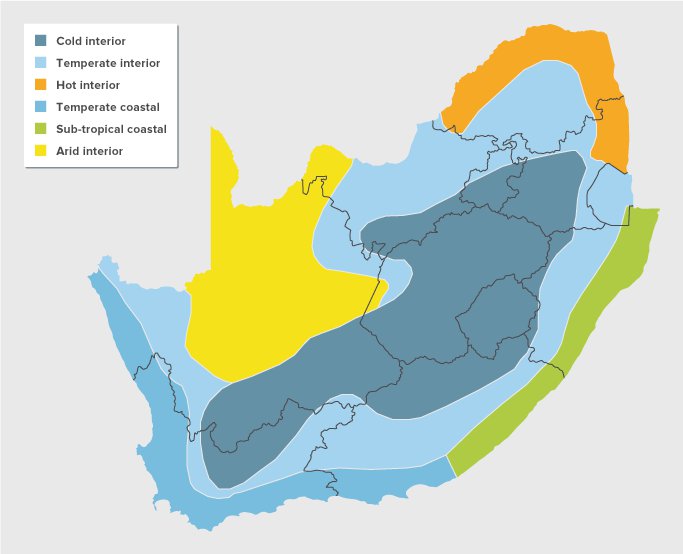
The climate classification for the building sector for South Africa, according to the building energy standard SANS 10400-XA, and SANS 204-2 (2008) is divided into 6 climatic zones. These climate zones being:
The parameters to define these climate zones are based on dry bulb temperatures; thermal neutrality, humidity and southern coastal condensation risk.
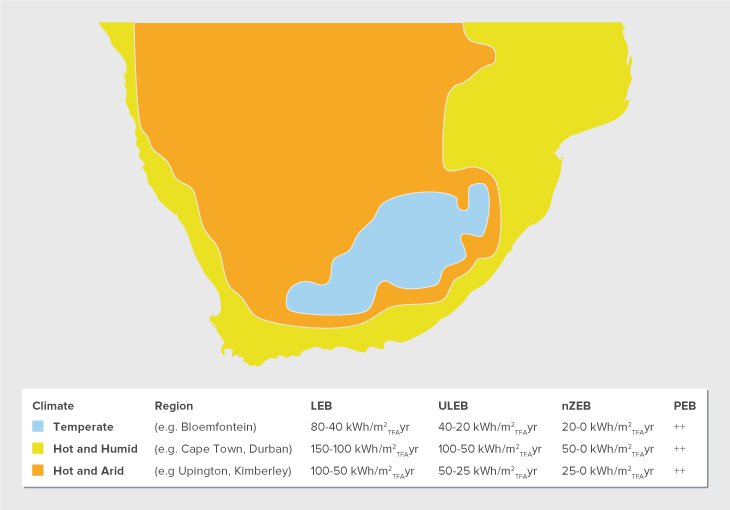
The climate classification for the building sector within the bigEE project differs from that of the South African Building Standard climate definition. The bigEE climate definition is that of a degree-day system. This is based on both the heating degree-days, cooling degree-days as well as the humidity. For sim-plicity the world’s climate was divided into four major climatic zones, Cold, Temperate (Note: these are not the same climate zones as in the climate definition for South Africa according to the South African Energy Building Standards), Hot and Humid and Hot and Arid. Each of these regions or zones has dif-ferent requirements with respect to heating and cooling energy needs. The focus for energy-efficient measures therefore varies between different climatic regions.
Cold climates have a high heating demand for all or part of the year and no or little cooling demand. Climatic conditions are cool with four distinct seasons cold to very cold winters, with cool to warm summers and variable spring and autumn conditions.
Heating Degree Days18°C ≥ 1000, Cooling Degree Days10°C < 1000
Temperate climates have both a heating and cooling demand for all or part of the year. Climatic condi-tions are with four distinct seasons cool to cold winters, mild to warm summers and variable spring and autumn conditions. These climatic regions require no or very little cooling in summer.
Heating Degree Days18°C ≥ 1000, Cooling Degree Days10°C ≥ 1000
Hot and Arid climates have a cooling and no heating demand throughout the year as well as low relative humidity levels throughout the year. These climates have hot to very hot summers with little rainfall and low humidity throughout the year. In addition to this the solar insolation tends to be extremely high. The difference between diurnal and nocturnal temperature is quite high. Depending on location the temperatures can become cool during the winter.
Heating Degree Days18°C <1000, Cooling Degree Days10°C ≥ 1000, Humidity ≤ 50%
Hot and Humid climates have a cooling and no heating demand throughout the year as well as a high humidity level throughout the year. The summers are hot to very hot with humidity levels of over 50%. They often require no or very little heating in winter depending on the geographical location.
Heating Degree Days18°C <1000, Cooling Degree Days10°C ≥ 1000, Humidity > 50%
| Climate | Typical City or Region | CDD10°C | HDD18°C | Humidity hottest month |
|---|---|---|---|---|
| Cold | n.a | < 1000 | ≥ 1000 | n.a. |
| Temperate | Bloemfontein | ≥ 1000 | ≥ 1000 | n.a. |
| Hot - Dry | Upington | ≥ 1000 | < 1000 | ≤ 50% |
| Hot - Humid | Cape Town | ≥ 1000 | < 1000 | ≥ 50% |
| City | HDD18°C | CDD10°C | Humidity (warmest month) % | bigEE Climate |
|---|---|---|---|---|
| Aliwal North | 1392,4 | 2160,9 | 58 | Temperate |
| Beaufort West | 993,2 | 2753 | 62 | Hot and Humid |
| Bethlehem | 1620,6 | 1733,9 | 68 | Temperate |
| Bloemfontein | 1437,8 | 2251,6 | 54 | Temperate |
| Botshabelo | 775,7 | 2738,9 | 63 | Hot and Humid |
| Cape St Francis | 568,7 | 2613,4 | 83 | Hot and Humid |
| Cape Town | 959,1 | 2257,4 | 73 | Hot and Humid |
| Deaar | 1181,8 | 2634,4 | 49 | Temperate |
| Durban | 150,8 | 3837,2 | 81 | Hot and Humid |
| East London | 461,4 | 2966,6 | 66 | Hot and Humid |
| Estcourt | 903,8 | 2524,3 | 81 | Hot and Humid |
| Ibhayi | 1120,7 | 2472,8 | 74 | Temperate |
| Johannesburg | 1154,9 | 2084 | 74 | Temperate |
| Kimberley | 934,8 | 3039,3 | 47 | Hot and Dry |
| Middelburg | 1443 | 2122,3 | 63 | Temperate |
| Mossel Bay | 510,8 | 2756,3 | 59 | Hot and Humid |
| Ntuzuma | 667,4 | 2933,8 | 90 | Hot and Humid |
| Pietermaritzburg | 660,5 | 3064,3 | 84 | Hot and Humid |
| Pietersburg | 733 | 2795,9 | 69 | Hot and Humid |
| Port Elizabeth | 601,7 | 2702,2 | 79 | Hot and Humid |
| Springbok | 962,4 | 2869,7 | 35 | Hot and Dry |
| Upington | 674,2 | 3805 | 33 | Hot and Dry |
National partners for South Africa


Building sector
The construction of a new building is an extremely complex process. In each of the three main phases of development, construction, and operation, there are several interlinked steps in the value chain that have to be co-ordinated. This process involves a correspondingly large number of different market actors, the most relevant of which are architects, developers, financiers, builders, contractors, component suppliers, and last but not least investors, building owners, tenants, and individual users. In addition, there are also some actors that are not part of the value chain itself, but nevertheless play important roles in influencing market decisions, such as public authorities, energy agencies, and energy service companies (ESCOs) – to name just a few.
Processes for energy-efficient building refurbishment are quite similar to new build and involve many of the same actors, although they normally exclude the tasks and actors of property development and sale or letting. Such renovation processes and actor constellations are thus almost as complex as those for new buildings. The following figure illustrates the distinctive complexity of the building sector. It shows how the different phases and tasks that form the links of the value chain as well as respective influencing factors interact.
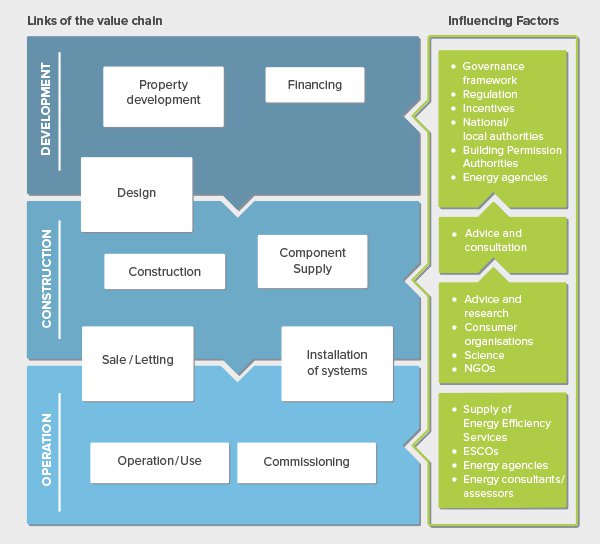
| Property development | - Property development companies - (Social-)Housing companies - Investor-occupier |
| Financing | - Banks - Equity funders - PPP - Insurances - Property Valuers |
| Design | - Architects - Engineering consultants |
| Component supply | - Component manufacturers - Wholesale and retail |
| Construction | - General management companies - Construction companies and contractors - Manufacturers of pre-fabricated houses |
| Installation of systems | - System suppliers - Installation contractors |
| Sale/letting | - Property development companies - Manufacturers of pre-fabricated houses - Housing corporations - Real estate agents - Landlords/Landladies - Buyers - Tenants |
| Commissioning | - Commissioning providers - Engineering consultants - Facility managers |
| Operation/use | - Investor-occupiers - Landlords/Landladies - Tenants - Employees - Customers - Facility managers |
Appliances sector
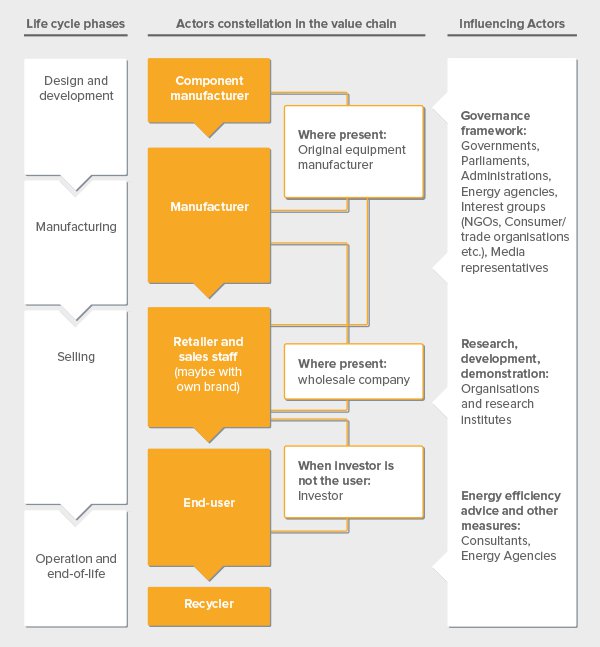
In each of the main life-cycle phases of an energy-efficient appliance, from development to recycling, there are several interlinked steps in the value chain that have to be co-ordinated. Consequently, this process involves a large number of different market actors like manufacturers, retailers, wholesale companies, investors, and users. As with buildings, there are also some actors that are not part of the value chain for appliances itself, but nevertheless have an important role to play in influencing the decisions of the market actors - for instance: public authorities, energy agencies, research institutes, and interest groups.
The following figure illustrates how the relevant actors in the appliances value chain interact in the different life cycle phases of appliances. The arrows demonstrate the supplier relations. On the right side of the figure, you can see the different actors, which have possibilities to influence the design, manufacturing, sale, or use of the product. Different actors can help to reduce the energy consumption of appliances via the governance framework, research and development activities, energy efficiency advice or other measures.
