Currently, India is amongst one of the fastest growing economies in the world. The two key activity drivers that influence the energy demand in the country- population and GDP, have seen a rapid growth in the last few years and are projected to climb higher in the coming years.
This rapid growth in the economy is facilitating rapid growth rate in urbanization, high demand for infrastructure and buildings and thus an increasing demand for energy. The building sector (comprising of residential and commercial sectors) contribution to the overall electricity consumption (from utilities) has grown from 15% in the year 1970-71 to 30% in year 2013-14.
At present on an average the building sector consumes about 30% of the overall electricity consumption (from utilities) by the country, out of which almost 72% is consumed by the residential sector. A more deeper look into the energy consumption pattern of the residential sector shows that fans and lighting consume more than 60% of total the consumption. The average household will consume five times more electricity in 2020 as compared to year 2000.
As per a study by the McKinsey Global Institute (MGI) if India continues its recent growth, average household incomes will triple over the next two decades (Ablett et al., 2007). Higher income will result in increase in the disposable income of the households, resulting in increased spending. With reference to the year 2011, by 2021 the electricity consumption by heating/ cooling appliances and by lighting will grow by 180% and 80% respectively (TERI, 2015).
For the commercial sector, as per the data available, if buildings continue to be built and operated in the conventional manner, electricity consumption by commercial buildings may increase by more than 3 times by 2021. 55% of energy consumption in commercial buildings is due to HVAC systems.
The sector wise consumption of electricity in India, based on the latest data available with Ministry of Statistics and Programme Implementation for the year 2012-13 is given in the figure below. The domestic and commercial sector in total accounts for almost 30% of the total nation’s electricity consumption.
 during 2012-13")
The World Bank in their study on “Residential Consumption of Electricity in India: Documentation of Data and Methodology, July 2008” employed a bottom up end use modelling approach to determine the residential end use electricity consumption. The main components used by the World Bank are household surveys, household electrification rate and appliance ownership. The model estimates the total electricity consumption of 136 TWh in the Indian household sector in 2006 and its breakup is given in the figure below.

The electricity consumption breakup in the commercial sector has been estimated by the Bureau of Energy Efficiency and is given in the below figure. The electricity consumption in HVAC (Heating Ventilation and Air Conditioning) is maximum and comprises of 55% of the total electricity consumption, lighting and internal loads comprises of 25% and 15% respectively.

The Strategic Approach is a worldwide valid recommendation for energy consumption levels. A Strategic Approach to integrated building design is the key to achieving high-energy savings at low or no extra cost in residential buildings. bigEE recommends using this Strategic Approach for energy efficiency in buildings.

The following table lists the energy consumption ranges as set by bigEE to achieve LEB, ULEB and nZEB/PLEB.
(Note: For climate zone definitions for India please read the Climate text under Overview. The values for strategic approach have been calculated based on the assumptions of a heating setpoint of 20 °C and cooling setpoint of 26 °C and that the mechanical heating and cooling systems will operate continuously to meet the set points in the space. However, in practice this might not be the case always because user behaviour, adaptive comfort conditions and other socio-economic conditions influence the system operation. The values have been calculated for harsh climates and it is intended that buildings in milder climates should strive to achieve lower energy consumption than the prescribed values.)
| Cold | Temperate (e.g. Srinagar) | Hot and Humid (e.g. New Delhi, Mumabi, Bangalore) | Hot and Arid (e.g. Jaipur, Hyderabad) | |
|---|---|---|---|---|
| kWh/m2TFAyr | kWh/m2TFAyr | kWh/m2TFAyr | kWh/m2TFAyr | |
| LEB | 40 – 80 | 40 – 80 | 100 – 150 | 50 – 100 |
| ULEB | 20 – 40 | 20 – 40 | 50 – 100 | 25 – 50 |
| nZEB | 0 – 20 | 0 – 20 | 0 – 50 | 0 – 25 |
| PEB | ++ | ++ | ++ | ++ |
For detailed information on the Strategic Approach please see the Strategic Approach text of the Interactive Buildings Guide more ...
| Building components |
Normal Practice | Optimized Case |
|---|---|---|
| Exposed Roof | The roof composition generally comprises of 100-150 mm Reinforced Cement Concrete with 100-120 mm Brick bat coba treatment for waterproofing. | The optimized roof composition is similar to normal practice roof with adequate quantity of insulation added as per the recommendation of Energy Conservation Building code of India. |
| External Wall | The wall options in the normal practice may comprise of 230 mm brick wall with 12 mm plaster on both sides, or, A cavity brick wall with different thickness of mm) on both sides and a cavity in between (max. up to 100 mm).bricks (230 mm / 125mm) on both sides and a cavity in | The optimized wall may comprise of AAC blocks with adequate insulation or normal practice wall with insulation as per the recommendation of Energy Conservation Building Code of India |
| External Glazing | The glass is generally single clear glass of 6 mm, with a solar heat gain coefficient (SHGC) greater than 0.7. | The glass is generally a double glazed glass with better solar heat gain coefficient (SHGC), or as per the recommendation of Energy Conservation Building code of India. |
| Glass Shading | The glass is partially shaded with external shading mechanism such as overhangs/ fins or recessed windows. | The glass is fully shaded in the critical period, which is normally considered for day hours from April to September. |
| Roof Shading | Roof shading is generally not being practiced. | The Roof shading is being practiced in few cases through different options such as PV panels, pergola, planters etc. |
| Roof Reflectivity | Only partial roof reflectivity is practiced in conventional buildings using broken china mosaic tiles. | Heat reflective tiles or reflective paints are being used to reduce the heat ingress. |
| Solar passive features | Rarely practiced | Use of effective use of thermal mass, optimum fenestration area, solar chimney, night purging, comfort ventilation, orientation, layout of buffer spaces etc. is being practiced in few cases. |
| Lighting System | Low efficiency fixtures such as fluorescent lamps and incandescent as well. | Efficient lighting fixtures (such as CFL, LED) with control system (such as occupancy sensors, timers, dimmers etc.). |
| HVAC System | Both centralized and distributed HVAC systems are installed, however the operating efficiency is lower due to operation & maintenance issues. | Centralized and distributed of higher efficiency rating are being used and timely operation & maintenance is being done. |
| Specific Energy Consumption | The EPI values exceeding the lowest BEE ranking for office building can be considered. The EPI is >195 kWh/m2/year | From the study carried out by TERI and data. EPI : 90-108 kWh/m2/year |
Further, this systematic tool will allow you to browse a list of strategies and recommendations, for building energy efficient buildings, in the four major world climates and types of building that might be of interest to you. Please choose a Climate Zone, State, Mode and Building Type to see our Recommendations on achieving LEB. ULEB and nZEB/PEB buildings.
Explore worldwide recommendations in the bigEE Buildings Guide
Here you can find examples of holistically planned and energy efficient Good Practice Buildings in India. These Good Practice Building examples provide essential information at a glance (key information including climate zone, building typology and primary energy consumption) and show detailed descriptions upon choosing any particular example (detailed description including passive architectural features, construction, techniques and technologies used as well as any special features and energy cost savings).
For Good Practice Building examples worldwide please go to the Interactive Buildings Guide Good Practice Buildings Residential and Non-residential
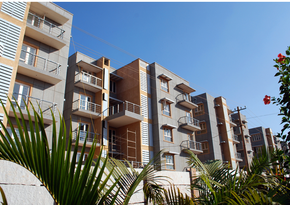
| Year | 2008 |
| Location | Bangalore, India |
| Area (TFA) | 60273 m2 |
| Dwellings | 132 |
| Cost | 83 EUR/m2 |
| Consumption | 39 kWh/m2/year (primary energy) |
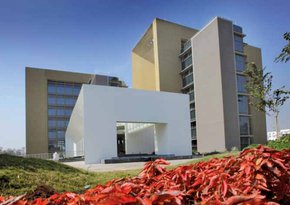
| Year | 2013 |
| Location | Pune, India |
| Area (TFA) | 10835 m2 |
| Dwellings | None |
| Cost | None EUR/m2 |
| Consumption | 12 kWh/m2/year (primary energy) |
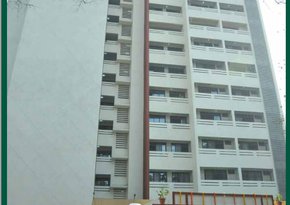
| Year | 2104 |
| Location | Chembur, India |
| Area (TFA) | 6968 m2 |
| Dwellings | 42 |
| Cost | 323 EUR/m2 |
| Consumption | 65.4 kWh/m2/year (primary energy) |
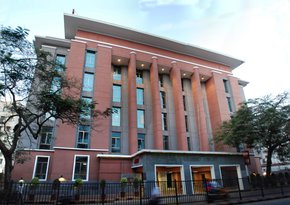
| Year | None |
| Location | Mumbai, India |
| Area (TFA) | 8012 m2 |
| Dwellings | None |
| Cost | 524 EUR/m2 |
| Consumption | 120 kWh/m2/year (primary energy) |
makes energy efficiency in buildings and appliances transparent. For investors, policy-makers and actors involved in implementation and consultancy. Learn more ...


 Buildings Guide
  Policy Guide
  Appliances Guide
  India
India South Africa